Adds soccer pitch markings as a layer for use in a ggplot plot.
Source:R/annotate_pitch.R
annotate_pitch.RdAdds soccer pitch markings as a layer for use in a ggplot plot.
annotate_pitch(
  colour = "dimgray",
  fill = "white",
  limits = TRUE,
  dimensions = pitch_opta,
  goals = goals_box,
  linewidth = 0.5,
  alpha = 1,
  linetype = "solid"
)
Arguments
- colour
Colour of pitch outline.
- fill
Colour of pitch fill.
- limits
Whether to adjust the plot limits to display the whole pitch.
- dimensions
A list containing the pitch dimensions to draw. See
help(pitch_opta).- goals
A function for generating goal markings. Defaults to
goals_box. Seehelp(goals_box). Formulas are turned into functions withrlang::as_function.- linewidth
The linewidth of the pitch markings
- alpha
The transparency of the pitch markings and fill
- linetype
The linetype of the pitch markings (e.g. "dotted")
Value
list of ggplot geoms to be added to a ggplot plot
Examples
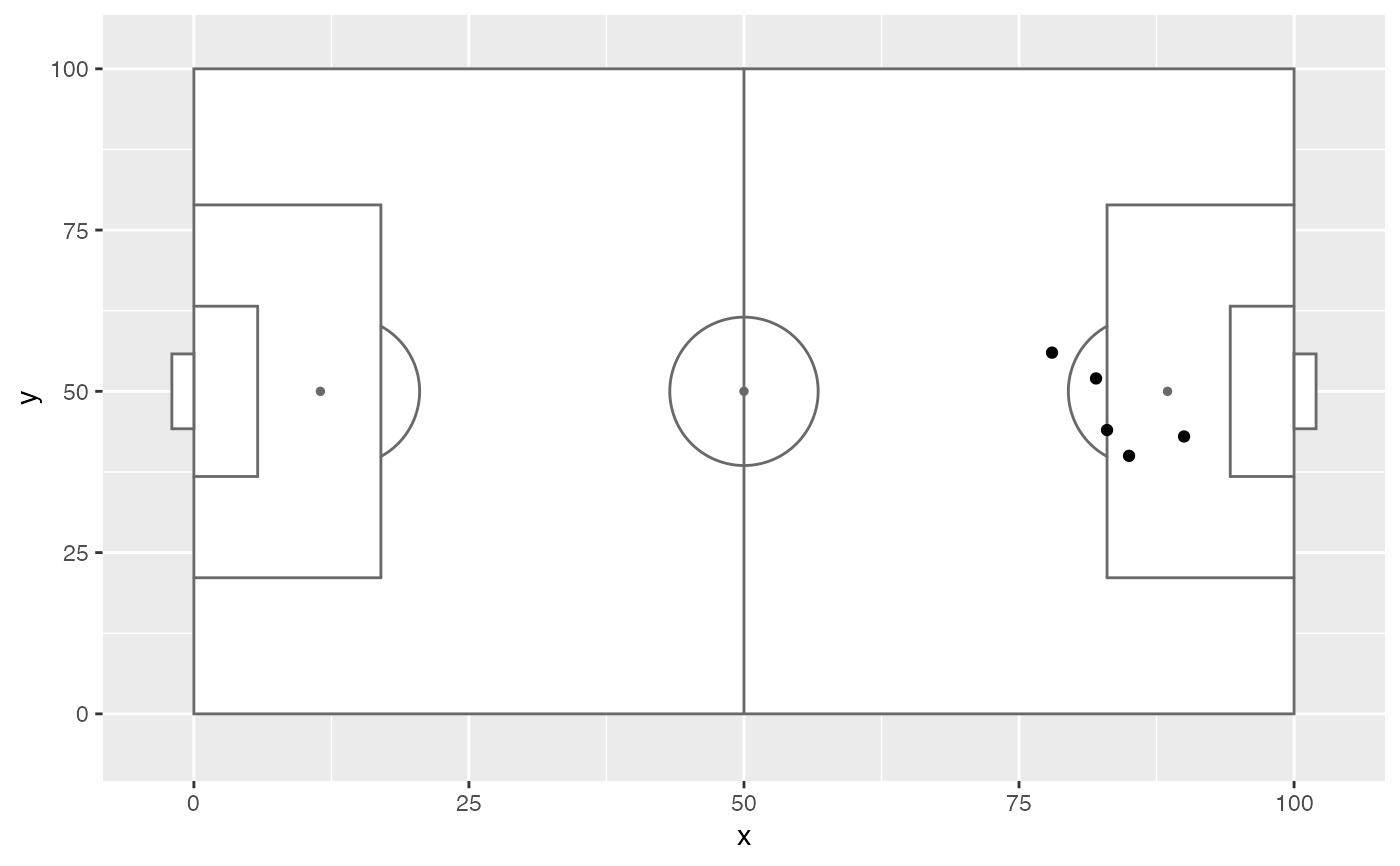
library(ggplot2)

shots_data <- data.frame(x = c(90, 85, 82, 78, 83),
                         y = c(43, 40, 52, 56, 44))

ggplot(shots_data, aes(x = x, y = y)) +
  annotate_pitch() +
  geom_point()