Various functions can be supplied to annotate_pitch to specify the appearance
of goals in the resulting plot.
goals_box(
  colour,
  fill,
  dimensions,
  linewidth = 1,
  alpha = 1,
  linetype = "solid",
  offset = 2,
  ...
)

goals_strip(
  colour,
  fill,
  dimensions,
  linewidth = 1,
  alpha = 1,
  linetype = "solid",
  offset = 1,
  lineend = "round",
  ...
)

goals_line(
  colour,
  fill,
  dimensions,
  ...,
  linewidth = 1,
  linetype = NULL,
  relative_width = 3
)
Arguments
- colour
Colour of pitch outline.
- fill
Colour of pitch fill.
- dimensions
A list containing the pitch dimensions to draw. See
help(pitch_opta).- linewidth
Determines line thickness in
goals_stripandgoals_line.- alpha
Determines alpha in
goals_box.- linetype
Determines linetype in
goals_boxandgoals_strip.- offset
Determines how deep the goal extends.
- ...
Passed onto underlying
ggplot2::annotatecalls.- lineend
Determines lineend in
goals_stripandgoals_line.- relative_width
Determines relative width of the goal marking to the pitch markings in
goals_line.
Value
list of ggplot geoms to be added to a ggplot plot
Details
Each function takes colour, fill, and dimensions arguments. User-defined
functions with the same arguments can also be used
Examples
library(ggplot2)
shots_data <- data.frame(x = c(90, 85, 82, 78, 83),
y = c(43, 40, 52, 56, 44))
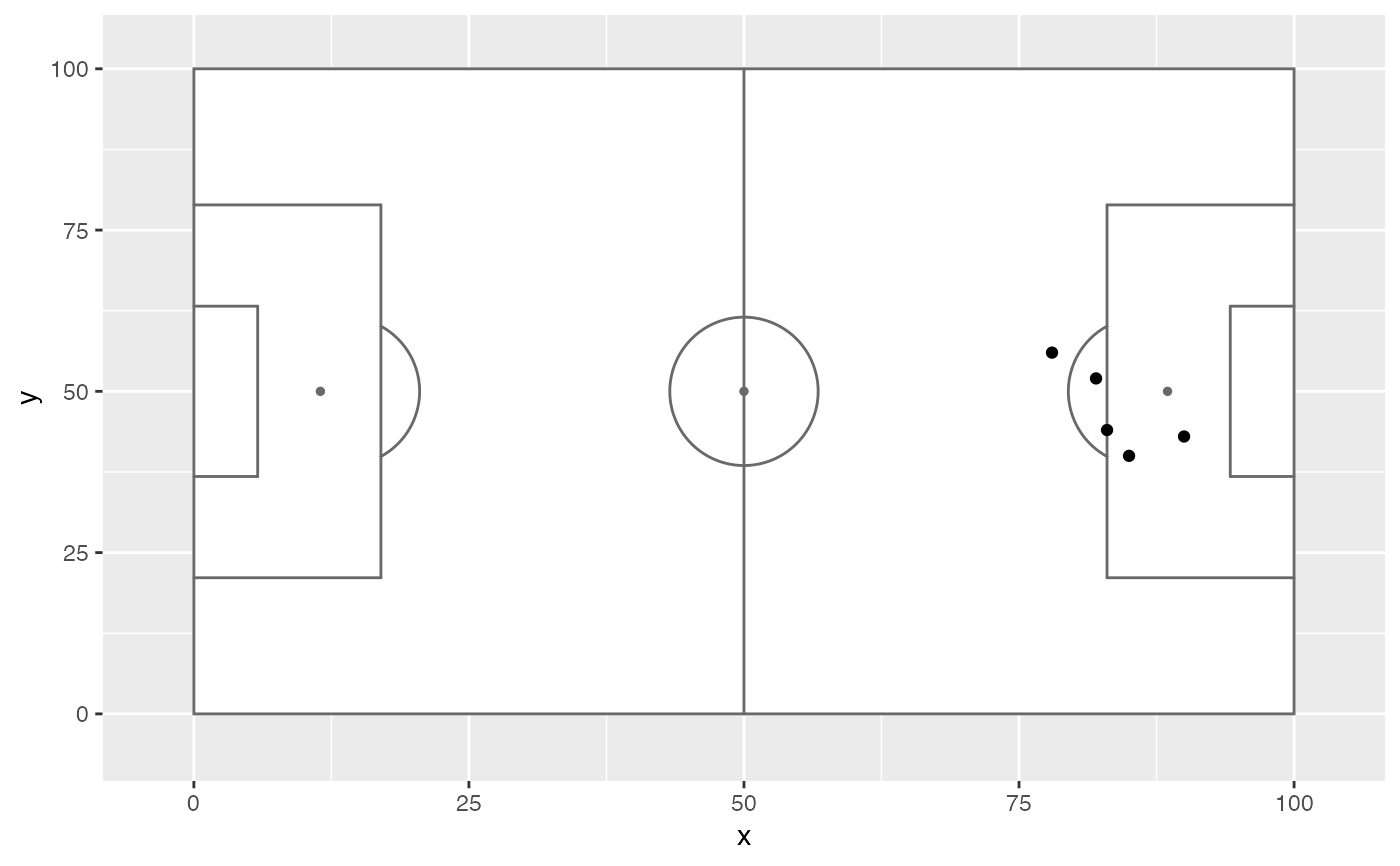
# Default
ggplot(shots_data, aes(x = x, y = y)) +
annotate_pitch(goals = goals_box) +
geom_point()
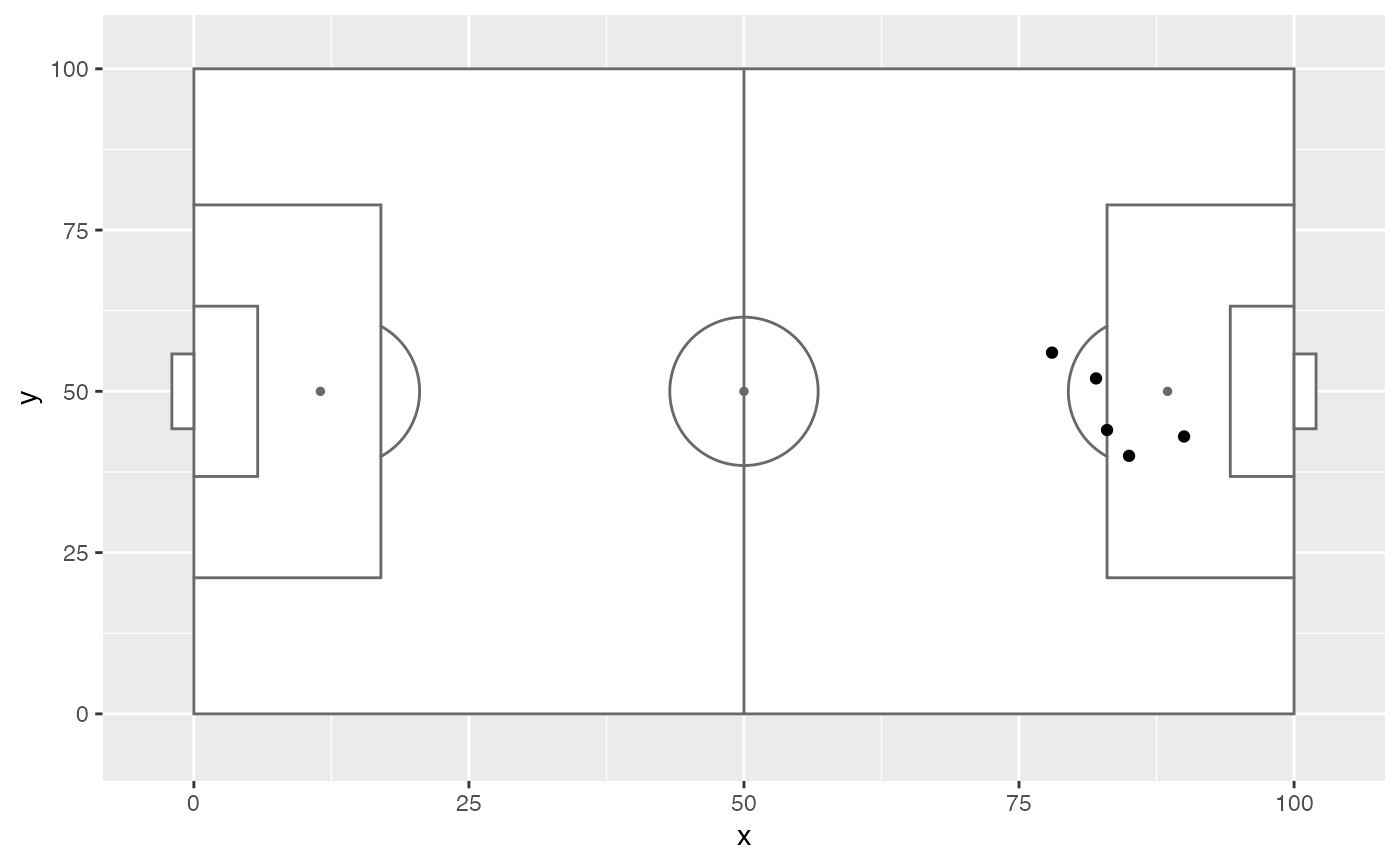 # Other goals markings
ggplot(shots_data, aes(x = x, y = y)) +
annotate_pitch(goals = goals_strip) +
geom_point()
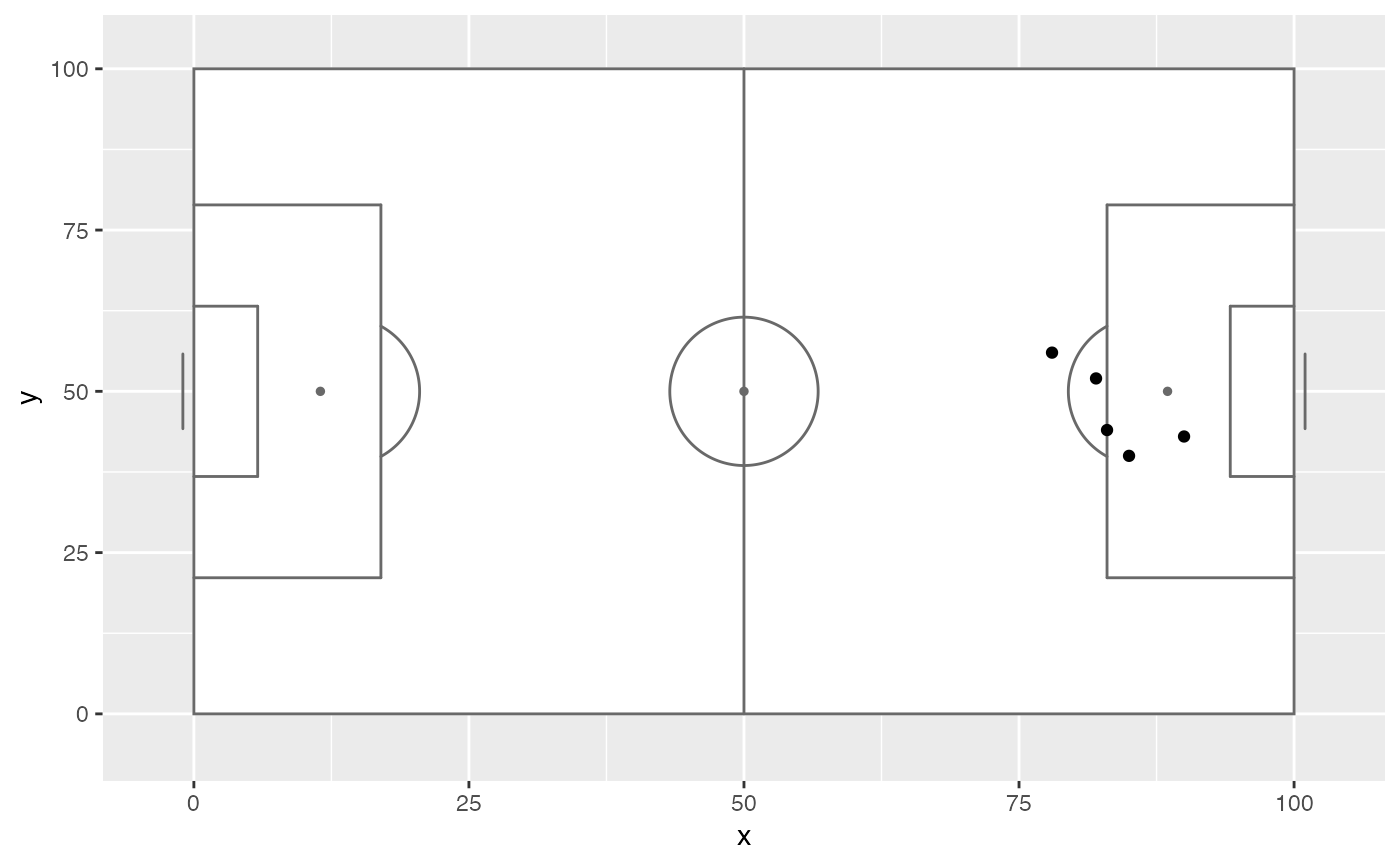
# Other goals markings
ggplot(shots_data, aes(x = x, y = y)) +
annotate_pitch(goals = goals_strip) +
geom_point()
 # Partial functions can be used to customise further
ggplot(shots_data, aes(x = x, y = y)) +
annotate_pitch(goals = ~ goals_box(..., offset = 4)) +
geom_point()
#> Warning: Removed 1 row containing missing values or values outside the scale range
#> (`geom_rect()`).
#> Warning: Removed 1 row containing missing values or values outside the scale range
#> (`geom_rect()`).
# Partial functions can be used to customise further
ggplot(shots_data, aes(x = x, y = y)) +
annotate_pitch(goals = ~ goals_box(..., offset = 4)) +
geom_point()
#> Warning: Removed 1 row containing missing values or values outside the scale range
#> (`geom_rect()`).
#> Warning: Removed 1 row containing missing values or values outside the scale range
#> (`geom_rect()`).